Nikola Tesla Books
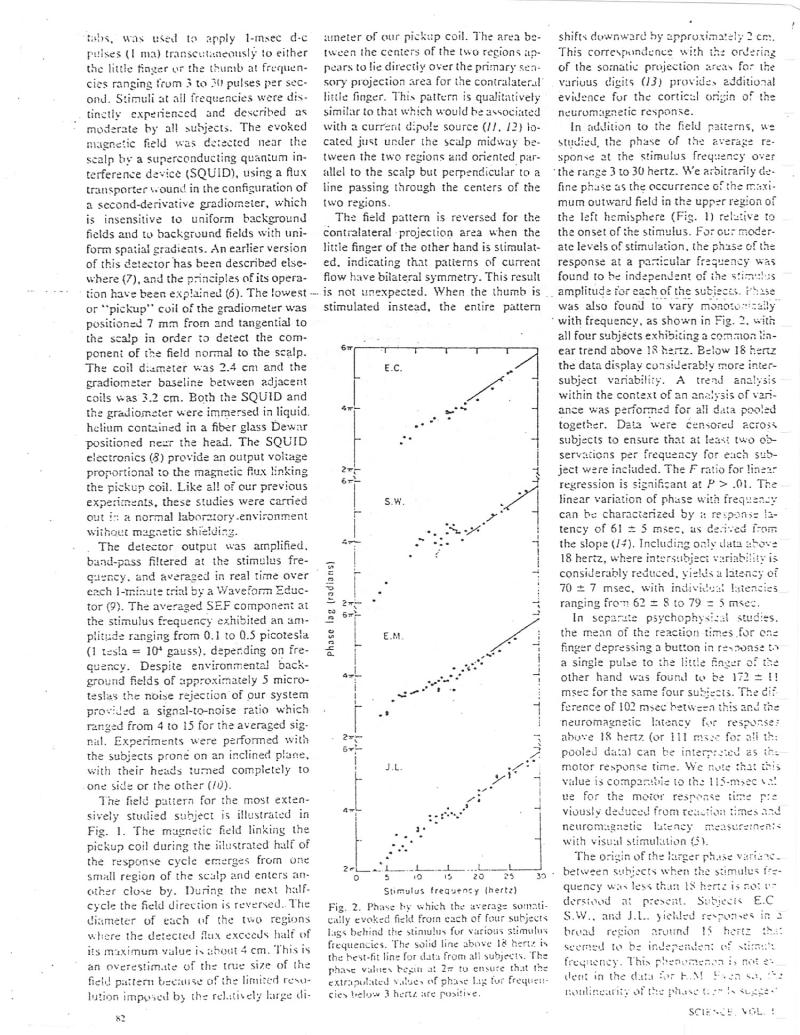
tabs, was used to apply 1-msec d-c pulses (I ma) transcutaneously to either the little finger or the thumb at frequencies ranging from 3 to 30 pulses per second. Stimuli at all frequencies were distinctly experienced and described as moderate by all subjects. The evoked magnetic field was detected near the scalp by a superconducting quantum interference device (SQUID), using a flux transporter wound in the configuration of a second-derivative gradiometer, which is insensitive to uniform background fields and to background fields with uniform spatial gradients. An earlier version of this detector has been described elsewhere (7), and the principles of its operation have been explained (6). The lowest or "pickup" coil of the gradiometer was positioned 7 mm from and tangential to the scalp in order to detect the component of the field normal to the scalp. The coil diameter was 2.4 cm and the gradiometer baseline between adjacent coils was 3.2 cm. Both the SQUID and the gradiometer were immersed in liquid. helium contained in a fiber glass Dewar positioned near the head. The SQUID electronics (8) provide an output voltage proportional to the magnetic flux linking the pickup coil. Like all of our previous experiments, these studies were carried out in a normal laboratory-environment without magnetic shielding. The detector output was amplified, band-pass filtered at the stimulus frequency, and averaged in real time over each 1-minute trial by a Waveform Eductor (9). The averaged SEF component at the stimulus frequency exhibited an amplitude ranging from 0.1 to 0.5 picotesla (1 tesla = 10 gauss). depending on frequency. Despite environmental background fields of approximately 5 microteslas the noise rejection of our system provided a signal-to-noise ratio which ranged from 4 to 15 for the averaged sig. nal. Experiments were performed with the subjects prone on an inclined plane, with their heads turned completely to one side or the other (10). The field pattern for the most extensively studied subject is illustrated in Fig. 1. The magnetic field linking the pickup coil during the ilustrated half of the response cycle emerges from one small region of the scalp and enters another close by. During the next halfcycle the field direction is reversed.. The diameter of each of the two regions where the detected flux exceeds half of its maximum value is about 4 cm. This is an overestimate of the true size of the field pattern because of the limited resolution imposed by the relatively large di82 ameter of our pickup coil. The area between the centers of the two regions appears to lie directly over the primary sensory projection area for the contralateral little finger. This pattern is qualitatively similar to that which would be associated with a current dipole source (11. 12) located just under the scalp midway between the two regions and oriented parallel to the scalp but perpendicular to a line passing through the centers of the two regions. The field pattern is reversed for the contralateral projection area when the little finger of the other hand is stimulated, indicating that patterns of current flow have bilateral symmetry. This result is not unexpected. When the thumb is stimulated instead, the entire pattern Phase lag (radians) 67 2TF 672T672 m E.C. S.W. E.M. J.L. 5 10 1 15 20 25 Stimulus frequency (hertz) Fig. 2. Phase by which the average somatically evoked field from each of four subjects lags behind the stimulus for various stimulus frequencies. The solid line above 18 hertz is the best-fit line for data from all subjects. The phase values begin at 2 to ensure that the extrapolated values of phase lag for frequen cies below 3 hertz are positive. 30. shifts downward by approximately 2 cm. This correspondence with the ordering of the somatic projection areas for the various digits (13) provides additional evidence for the cortical origin of the neuromagnetic response. In addition to the field patterns, we studied, the phase of the average re. sponse at the stimulus frequency over the range 3 to 30 hertz. We arbitrarily define phase as the occurrence of the maximum outward field in the upper region of the left hemisphere (Fig. 1) relative to the onset of the stimulus. For our moderate levels of stimulation, the phase of the response at a particular frequency was found to be independent of the stimulus amplitude for each of the subjects. Phase was also found to vary monotonically with frequency, as shown in Fig. 2, with all four subjects exhibiting a common linear trend above 18 hertz. Below 18 hertz the data display considerably more intersubject variability. A trend analysis within the context of an analysis of variance was performed for all data pooled together. Data were censored across subjects to ensure that at least two observations per frequency for each subject were included. The F ratio for linear regression is significant at P>.01. The linear variation of phase with frequency can be characterized by a response là - tency of 61 ± 5 msec, as derived from the slope (14). Including only data above 18 hertz, where intersubject variability is considerably reduced, yields a latency of 70 7 msec, with individual latencies ranging from 62 = 8 to 79 = 5 msee. In separate psychophysical studies. the mean of the reaction times for one finger depressing a button in response to a single pulse to the little Finger of the other hand was found to be 172 = !! msec for the same four subjects. The dif ference of 102 msec between this and the neuromagnetic latency for response: above 18 hertz (or 111 msee for all the pooled data) can be interpreted as the motor response time. We note that this value is comparable to the 115-msec val ue for the motor response time pre viously deduced from reaction times and neuromagnetic latency measurements with visual stimulation (5). The origin of the larger phase variano. between subjects when the stimulus frequency was less than 18 herte is not un derstood at present. Subjecis E.C S.W., and J.L.. yielded responses in 2 broad region around 15 hertz that seemed to be independent of stimul frequency. This phenomenon is not es dent in the data for F.M Even so, t nonlinearity of the phase turn is sugges SCIENCE, VOL. ! ?
